
Mercadolibre, Inc (MELI) and Wayfair (W)
By Tue, May 12, 2020
Hello,
This week, we’ve got not one but TWO charts of the week for everyone to take advantage of.
Both are in online retail, which is absolutely crushing it right now.
The strength we’re seeing in the Online Retail ETF (IBUY) is just unbelievable.
We’re seeing all-time closing highs on weekly and daily charts.
Now, while that’s a great opportunity to keep an eye on, we’re going a little deeper to find some even more skewed (in our favor, of course) risk to reward ratio.
We’re looking at two trades today, each with different situations.
The first one we’re looking at is Mercadolibre, Inc (MELI).
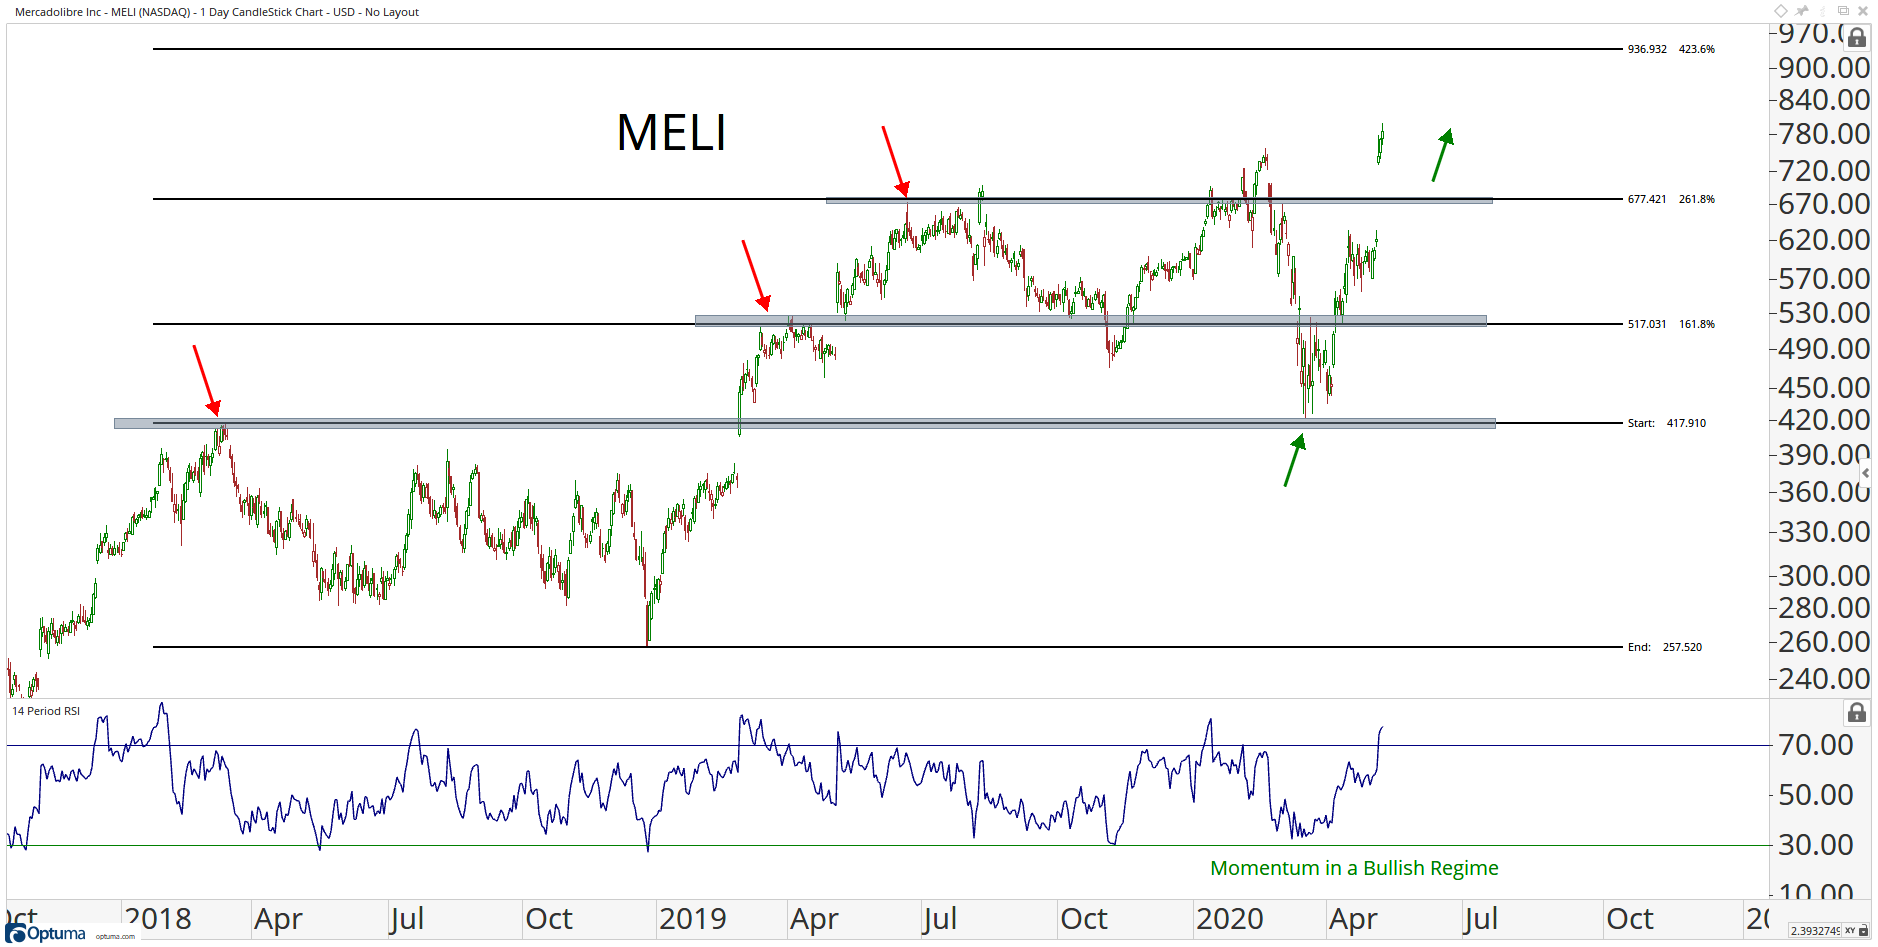
MELI has been on a good run of late, but seems to be coming back down to Earth.
We’re counting on that.
For Mercadolibre, we’re buying the pullback and going LONG above $677, with a target of $936 on the way back up.
Now, we’ve got another option in the same sector for those on a tighter budget.
Wayfair (W) is another buy.
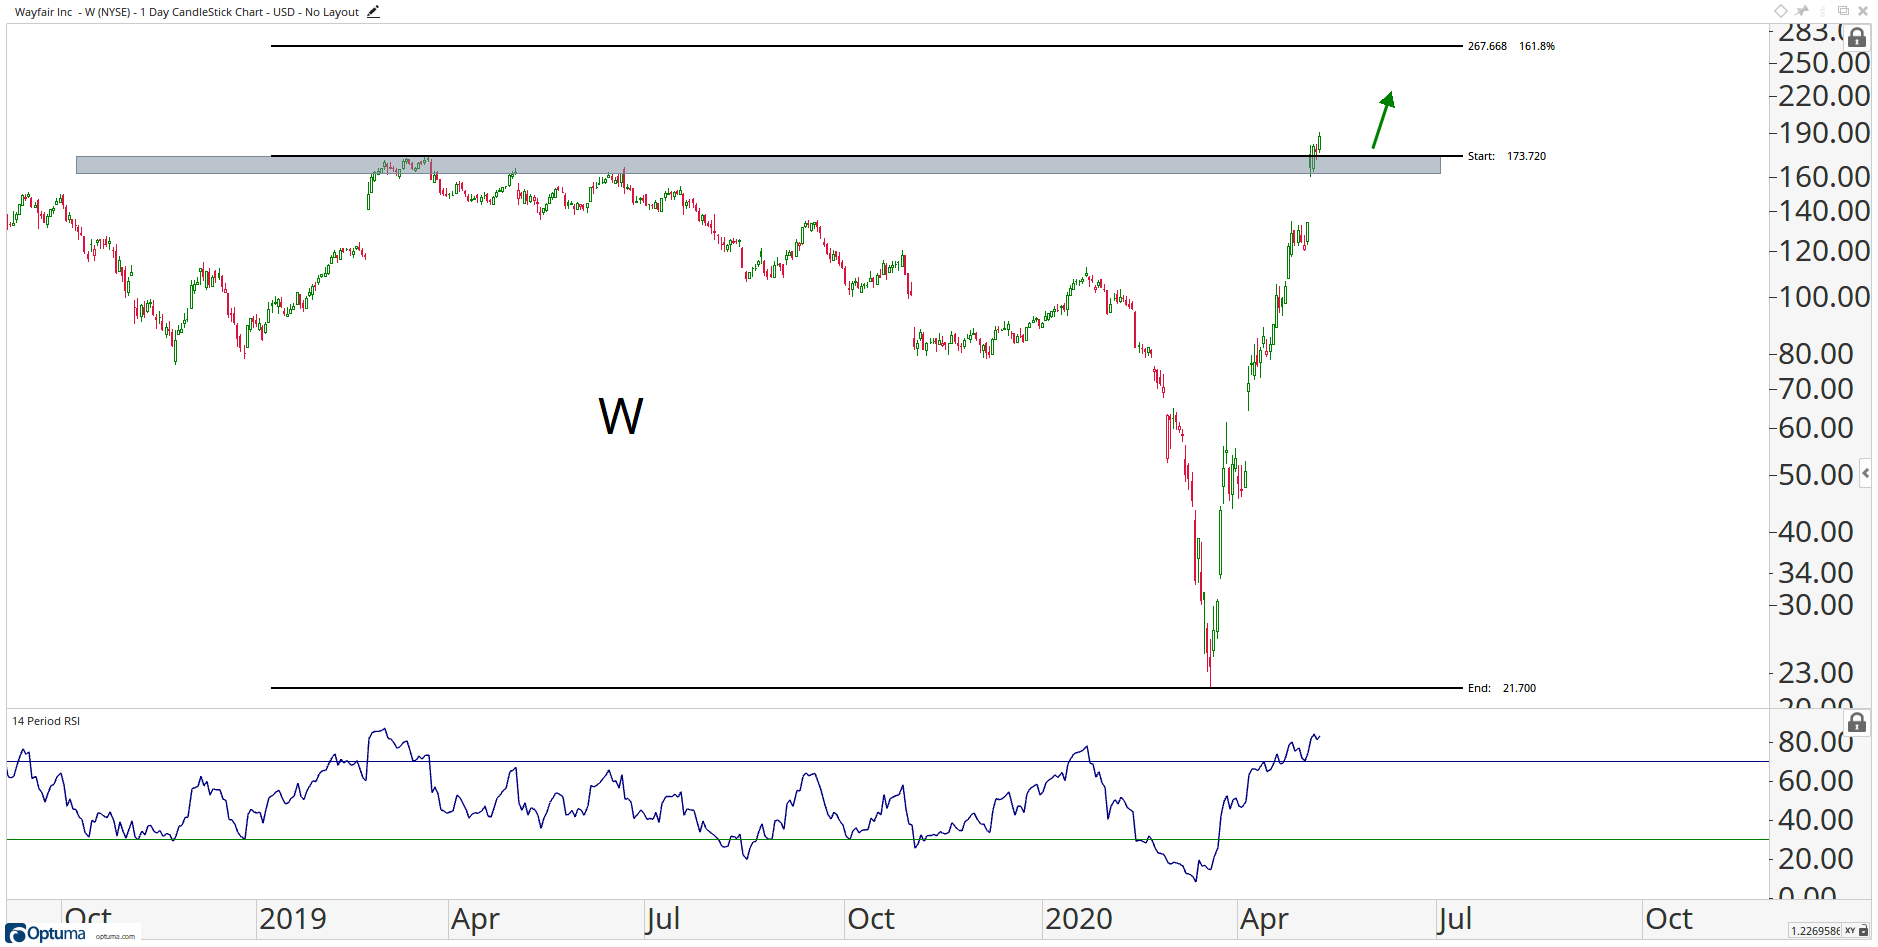
We’re long if we’re ABOVE $173, with a profit target of $267.
Til next time, good trading,

JC Parets
P.S. Join me LIVE this (and every) Thursday at 4pm EST/1pm PST for my weekly market debrief, general analysis, and top trade recommendations. Register today and claim your free spot.
Sponsored Ad
Special Invitation from Eccentric Millionaire
This is for your eyes only…
This millionaire from New York is inviting you to a special online event Wednesday May 27…100% FREE.
He says if you show up, your mornings might never be the same again.
About the Author
JC Parets, founder of All Star Charts, specializes in finding the most opportunistic risk vs. reward propositions while at the same time bringing a top/down approach to the marketplace whose wide spectrum is rivaled by few. JC begins with a long-term global macro perspective and then works his way down to the individual sector and industry level before ultimately isolating the stocks that best portray a particular thesis. Price is the most important technical indicator, but JC uses supplements such as Momentum, Relative Strength, and Fibonacci analysis to complete the process.