Snap, Inc. (SNAP)
By Thu, Jun 11, 2020
Hello fellow traders,
Today’s chart of the week comes out of the social media sector, which has been hot lately.
But in particular, I’m loving Snap (SNAP).
SOCL is an area within tech that we like a lot right now as it recently resolved out of a 2-year+ base to fresh all-time highs. High momentum and high beta names across all sectors are working very well right now. $SNAP is one of them.
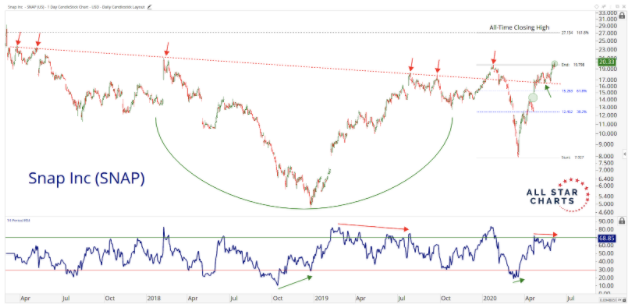
Not only that, but this name also falls into the “stay-at-home” category where we’ve had success with a variety of long setups in recent months. Risk is well defined as prices just broke out of a short-term base and reclaimed their YTD highs. What more could you want in a setup?
With a monster base, we like snap above $20, eyeing profit at $27
Below $20, we steer clear, but above that we’re looking at $27 for profit.
Now, we’ve also got another play for this one — options.
Our Options expert Sean McLaughlin recommends buying $SNAP August 25-strike calls for 74 cents or cheaper.
Once the call hits $1.50 take the original premium off the table and let it run from there since we’ve got til August.
That’s it til next week.
Good trading,

JC Parets
P.S. My new Technical Analysis course is OFFICIALLY live!
Feedback from everyone who’s gone through it so far has been absolutely amazing.
I knew it was good, but even I was blown away by all the comments from students.
When I hear people tell me that this is the best technical analysis training they’ve EVER seen, that validates all the hard work we put into this.
I’m so happy everyone noticed all the hard work and effort that went into even just the video production of the course.
And that the lessons were simple enough to understand and implement.
And you can get the first module free.

Sponsored Ad
Wouldn’t You Rather Trust Your Money To A.I.?
In today’s market, there may seem to be no rhyme or reason, but there ARE detectable patterns hidden beneath the surface, which is why you need artificial intelligence.
About the Author
JC Parets, founder of All Star Charts, specializes in finding the most opportunistic risk vs. reward propositions while at the same time bringing a top/down approach to the marketplace whose wide spectrum is rivaled by few. JC begins with a long-term global macro perspective and then works his way down to the individual sector and industry level before ultimately isolating the stocks that best portray a particular thesis. Price is the most important technical indicator, but JC uses supplements such as Momentum, Relative Strength, and Fibonacci analysis to complete the process.